Accel-PPP Prometheus Exporter
As infrastructure engineers, we often find ourselves bridging gaps between the tools we use and the monitoring systems we rely on. When I’ve migrated to Prometheus and Grafana on one of the sites, integrating Accel-PPP posed a unique challenge. The absence of native Prometheus support for Accel-PPP meant I was stuck with an SNMP-based monitoring setup, but relying on SNMP for metrics felt like patching a modern system with legacy tools—inefficient and less than ideal. Additionally Accel-PPP lacks any API or interface to get information about its state. This led me to develop accel-exporter.
For those managing Accel-PPP and seeking a simple - ready to use solution, accel-exporter offers a straightforward path to integrate with Prometheus and Grafana, enhancing observability without the SNMP overhead.
What does accel-exporter Do?
accel-exporter is a lightweight Prometheus exporter designed to:
- Extract Metrics: It interfaces with Accel-PPP’s accel-cmd utility to gather statistics.
- Expose for Prometheus: The extracted data is formatted and served over an HTTP endpoint (/metrics), ready for Prometheus to scrape.
- Simplify Integration: With minimal configuration, it fits seamlessly into existing Prometheus and Grafana setups, providing clear and actionable insights into BRAS performance.
Getting Started
Deploying accel-exporter is straightforward:
- Download the Binary: Grab the latest release from the GitHub repository.
- Set Permissions: Ensure it has the necessary permissions to execute accel-cmd.
- Run the Exporter: Launch it with your preferred settings. For example:
./accel-exporter --accel-cmd-path=/usr/bin/accel-cmd --web.listen-address=:9101
As accel-cmd can be overloaded to monitor remote host by providing flags
--hostand--port, which defaults tolocalhostand port2001.
- Configure Prometheus: Add the exporter’s endpoint to your Prometheus configuration to start collecting metrics.
scrape_configs:
  - job_name: 'accel-ppp'
    static_configs:
      - targets: ['localhost:9101']
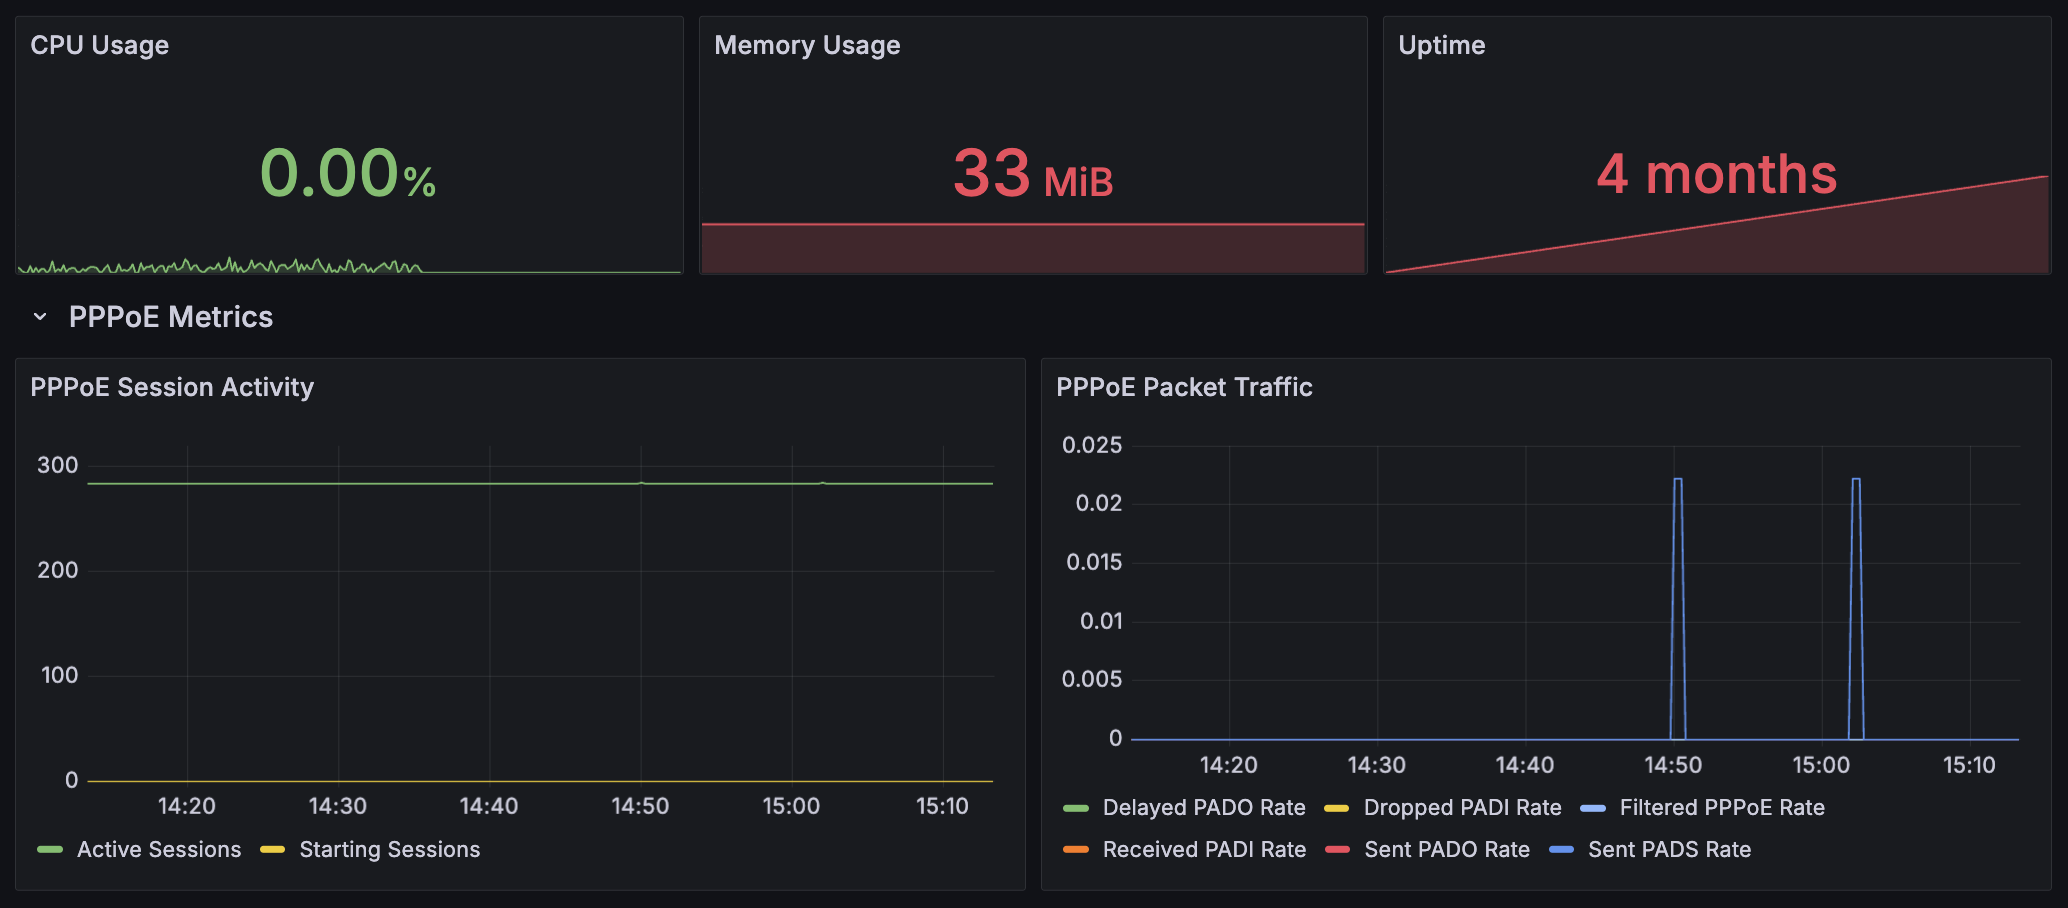
- Visualize with Grafana: Use Grafana to create dashboards and visualize the collected data. To simplify that process, I’ve also added a dashboard to the repository as a easy start.
Where to find it?
The source code, along with detailed documentation and resources, is available on GitHub at github.com/taihen.org/accel-exporter.
Licensed under the MIT License, accel-exporter is open for contributions. Whether you’re interested in reporting issues, suggesting enhancements, or submitting pull requests, your involvement is welcome.